Scrum team’s velocity is an average amount of work that meets the team’s definition of done, completed across several iterations. Velocity measures a team’s ability to operate and is the most essential input for capacity calculation, leading to business predictability.
It may seem confusing – let’s dive into some details.
How to measure work?
You can measure work in story points.
It is a unit to estimate the complexity, uncertainty, and labor intensity without considering time.
Every task is estimated in story points.
Meeting the definition of done
When planning the sprint scrum team must define what it means for the work to be done. Everyone must share the same ‘definition of done’ so it is imperative that it is written and everyone acknowledges it. We should specify acceptance criteria for each described task. Only then we have enough data to estimate work.
When tasks are considered done during the sprint – we sum up their estimates.
The amount of story points from all completed tasks during a sprint is the team’s velocity in this particular iteration.
To figure out the team’s overall velocity we need to have data from several representative iterations.
Representative iterations
We need to know how well the team operates at its best. That will be our basis for further modification.
Which sprint is the best sprint?
Answer the question: was it a sprint focused on development? Or was it an iteration full of unusual activities?
Was everyone present and focused? Or did someone go on vacation or was simply ill?
A sprint that represents the whole team’s undisturbed development ability when everyone is present is a representative sprint.
Every sprint is different – also those which are representative. If we can get velocity data from a few of those sprints we can take an average from them.
An average from those sprints is the team’s basic velocity.
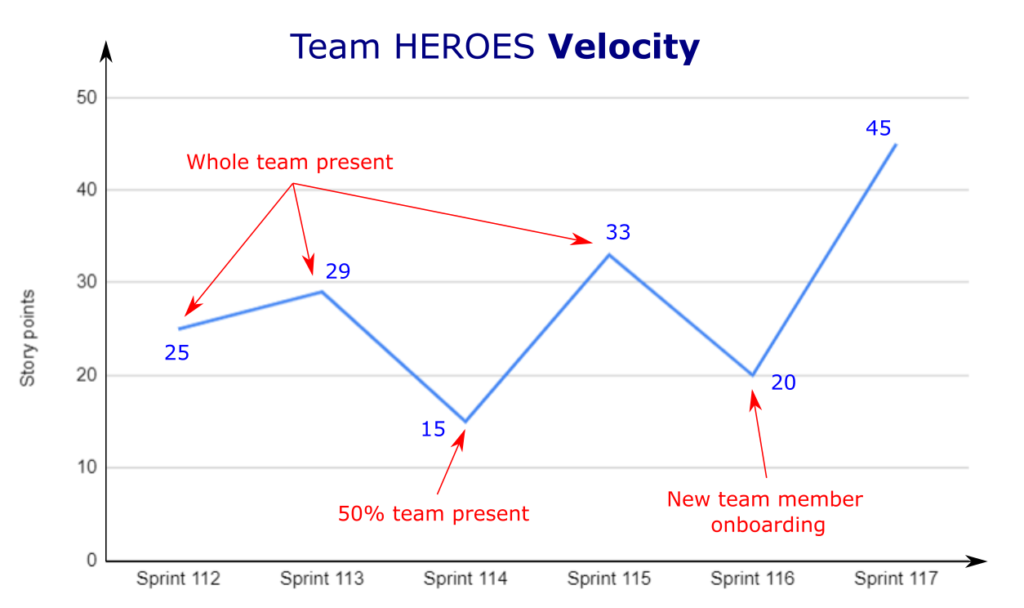
In a simple example below, the team had 3 sprints with all developers present. We have no other information about any significant disturbance. We can consider those sprints as representative of the team velocity. An average from sprints 112, 113, and 115 is 29.
Vacation, new member onboarding, and the best sprint with new member performing are not representative.
Velocity is for the team only!
Use the sum of story points only to know the velocity of the whole team.
Never compare the velocity of individuals to each other and to them selfs on the span of time.
It can not be a tool to measure performance. That kind of approach only leads to misunderstandings, underperformance, and team disintegration.
What do we track velocity for?
Velocity is changing all the time. We have to keep an eye on it!
Sprint planning
In scrum, we have to be able to plan our sprints. In order to do that we have to know how fast we can deliver desired features.
Based on past velocity data we can plan an iteration with a high probability of success.
Business planning
If a team can estimate work with high probability and has a steady velocity then the organization has the ability to estimate the time it needs to deliver a certain solution. It would still be an approximation but with a proper buffer, it is a good place to start contract negotiations.
Improvement
The velocity alone can’t tell you much about the team when searching for improvements. However, if you combine it with additional data you can possess a more complete view of what type of improvements a team needs.
Besides velocity that is completed work, for every sprint you should also track:
- amount of planned work
- amount of unfinished work
- status of unfinished work
- developers’ presence during the iteration
Above additional data doesn’t directly relate to velocity besides the presence of developers.
How to track the scrum team’s velocity?
You probably have reports regarding the team’s velocity for every sprint. In JIRA for example we have a couple of different reports from which we can tell at what rate the development team delivers features.
Those tools are great because they give an instant insight into every sprint’s statistics.
However, in my opinion, it is essential to add some other aspects of every sprint like:
- team members’ availability
- unplanned work needed to be done
- milestones like demo sessions, releases
- integration tests
- other events that significantly shorten sprint’s time for pure coding
In JIRA you have the velocity chart, sprint burn-down, burn-up, and many others but you can’t add any custom data to them.
The simplest way is to copy data from your issue tracking software into ms excel or google spreadsheet and then add to it what you need.
If you track unusual events, you can see how they affect the velocity. You can use that knowledge in future sprint capacity planning. If such complications are ahead of the team – reduce the capacity accordingly.
How to interpret changes in velocity
It is natural that the velocity changes. It usually oscillates around a certain number.
Sometimes an anomaly happens – a sudden spike or a dip in the chart. It can be an obvious consequence of other relevant team data like – absence. But occasionally there is no relation to any events, it’s a puzzle that should be discussed with the team.
Note that the behavior of the velocity chart is not proof of anything – it is only an indication that something is probably happening. Based on the velocity chart you can try to look for reasons with the team. Never judge or claim that you know upfront what is going on.
Spikes
It seems like every team member suddenly had a divine burst of productivity – it could be the case.
However, it can be the result of work overestimation during sprint planning. Tasks have turned out to be easier than expected and additional work is added to the sprint. Added work is also delivered before the end of the sprint because it is also overestimated.
Typically it occurs when the team is learning to estimate and has the tendency to perceive work as more difficult than it actually is. A spike is seen when work is ahead of the team and there is a lot of uncertainty.
Dips
A dip doesn’t mean that someone stopped working – but it sure can.
It is more likely that the team is underestimating tasks during sprint planning.
It can also mean that there were many disturbances in the sprint or unplanned work that wasn’t added to the sprint.
Or the product owner changed the requirements during the sprint and there was no sprint scope replanning.
Actually, the list can go on and on. You have to work it out with the team.
Uptrend
The team is improving its planning abilities or simply performs better and better from sprint to sprint.
It is also a good idea to figure out the reason for that – what are we doing right? Let’s do more of it!
Downtrend
The team probably has a problem that is getting bigger. Maybe the problem is outside of the team and affects it more and more. Scrum master should lead the team to find the source of the downtrend, ensure that a repair plan is developed, and ensure its execution.
Conclusion
Steady velocity leads to business predictability. You need to have both.